Civil Design Suite
for TurboCAD
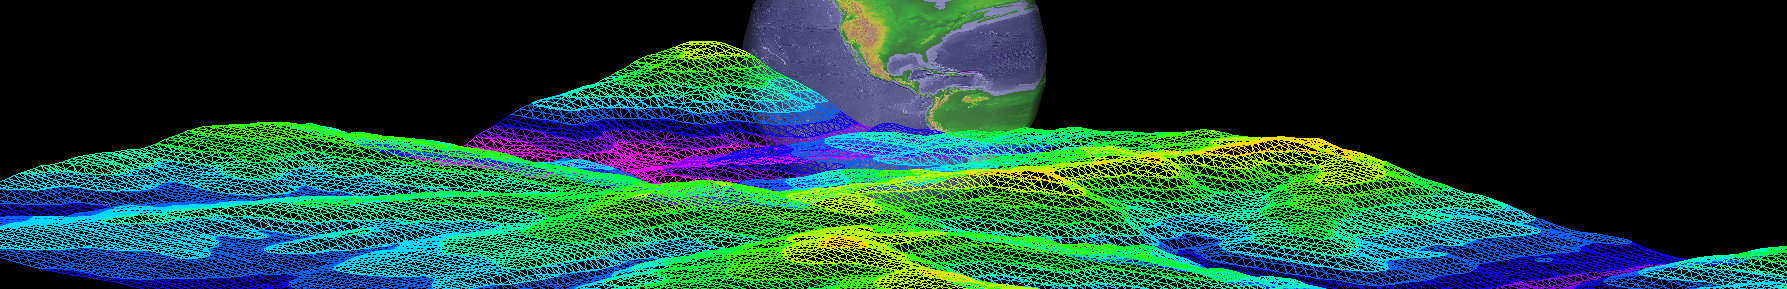
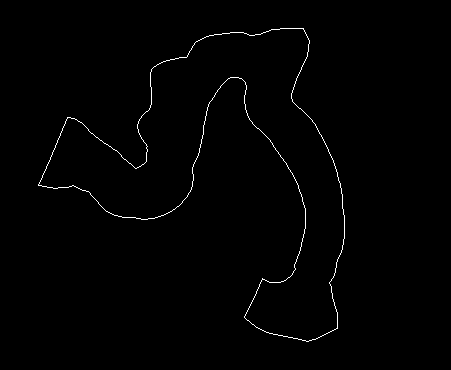
Most of the functionality of Surface Modeling require a TIN
surface to be active. To create one simply select your data and press the
“Create Triangles” button. ![]()
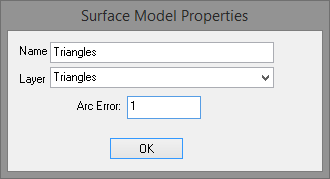
Arc Error is the maximum error when converting arcs to strait line segments.
See how it works: http://www.surfacemodeling.com/Downloads/Movies/EditingTriangles.wmv
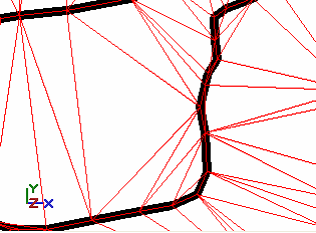
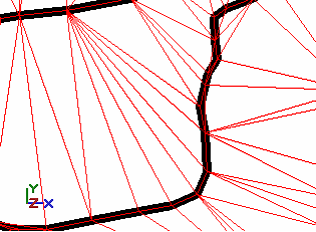
Single line in the data used to create a TIN will be considered soft break lines. Its’ segments will be triangle edges.
Double lines are soft break lines but when selected with a TIN for the creation of a TC surface or solid will be used to control the calculation of normal.
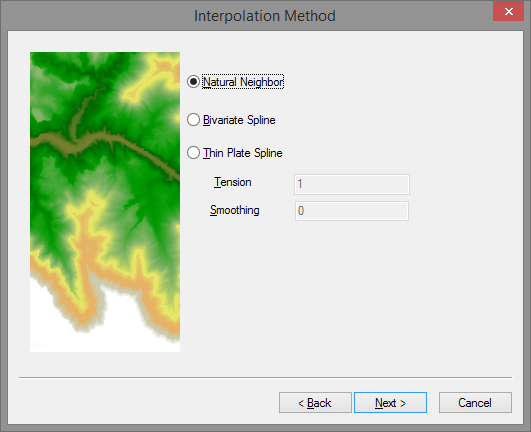
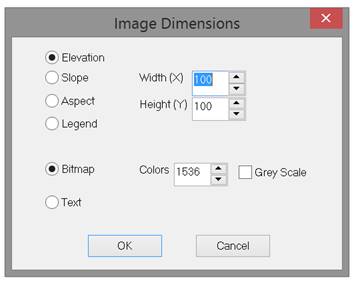
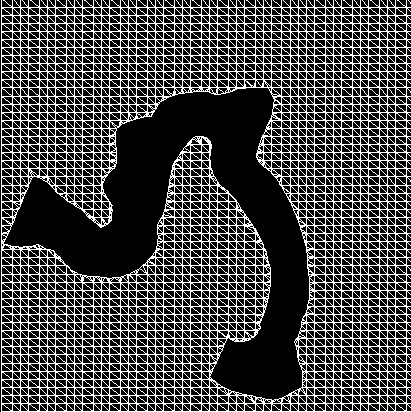
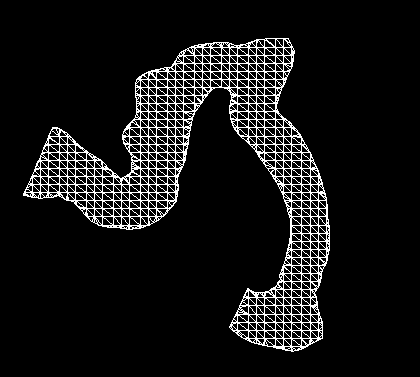
To create a surface your must have either a set of point and/or lines selected. Or you must have a triangulation active. The following dialog allows you to select whether the result is a set triangles or a triangulated grid.
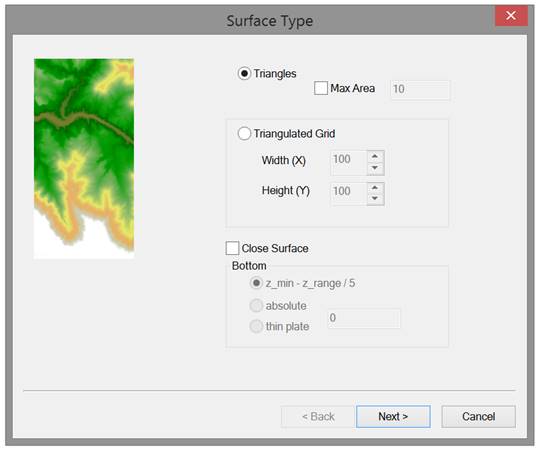
If you have only point data selected then this dialog allows you to select an interpolation method. Bivariate spline is used for all surface modeling interpolation.
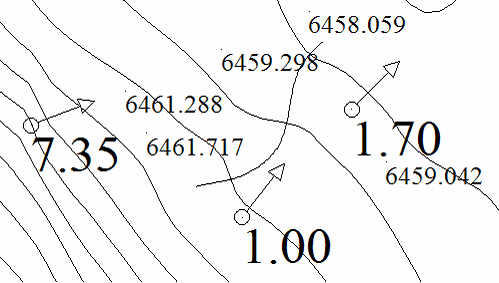
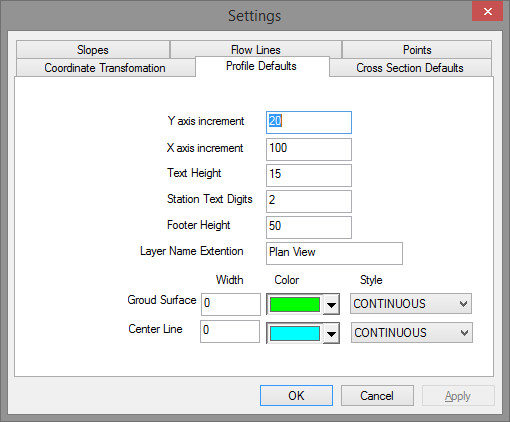
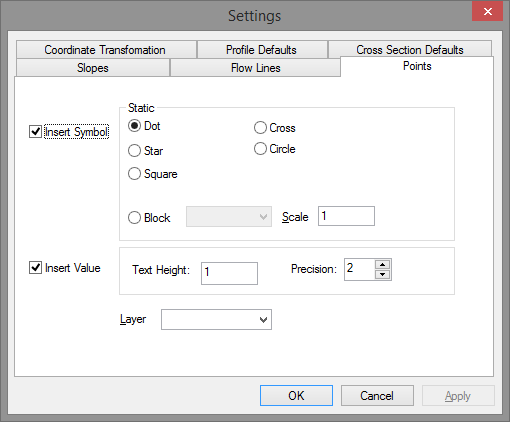
With a TIN active clicking anywhere on it will produce a point.
With a TIN active clicking anywhere on it will produce the arrow and value.
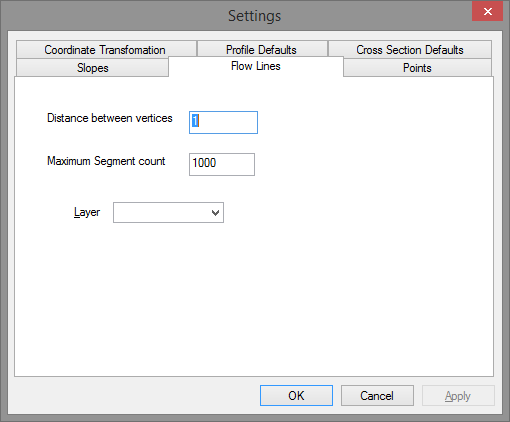
Flow lines ![]()
With a TIN active clicking anywhere on it will produce a line starting at that point. The length of the line is controled in settings.
A TIN must be active.
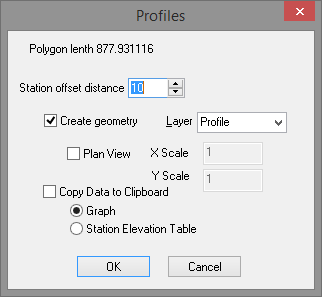
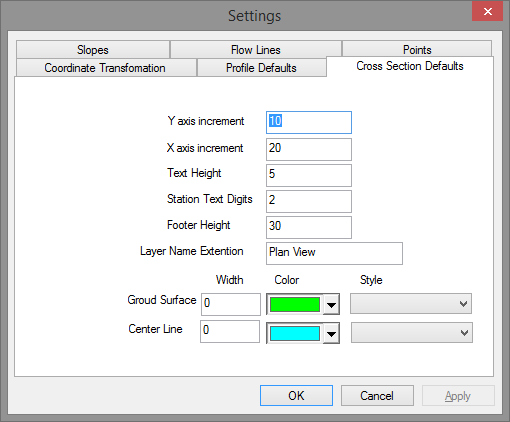
· Station interval distance
· Plan view
· Save data to clipboard
· Save simple graph to clipboard
Have an atcive TIN and polygon selected.
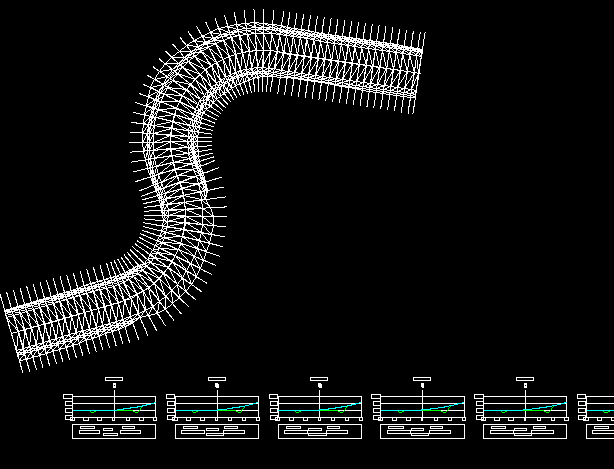
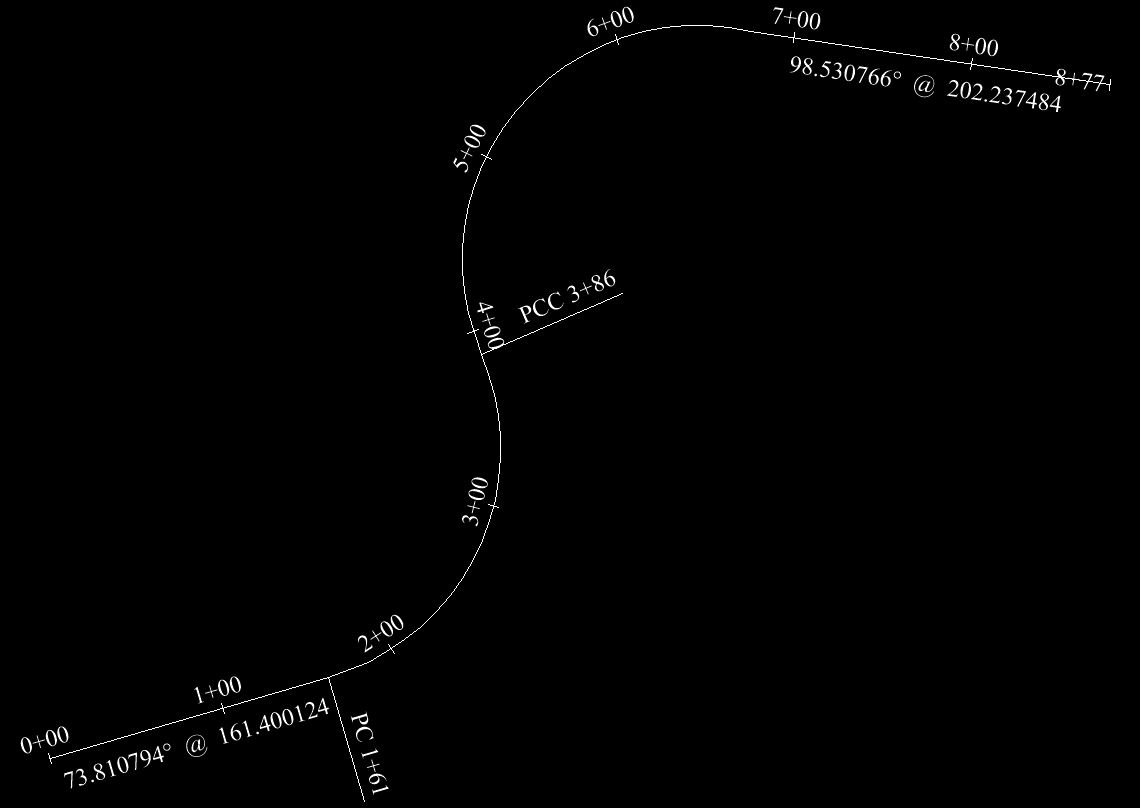
This is what the Plan View looks like:
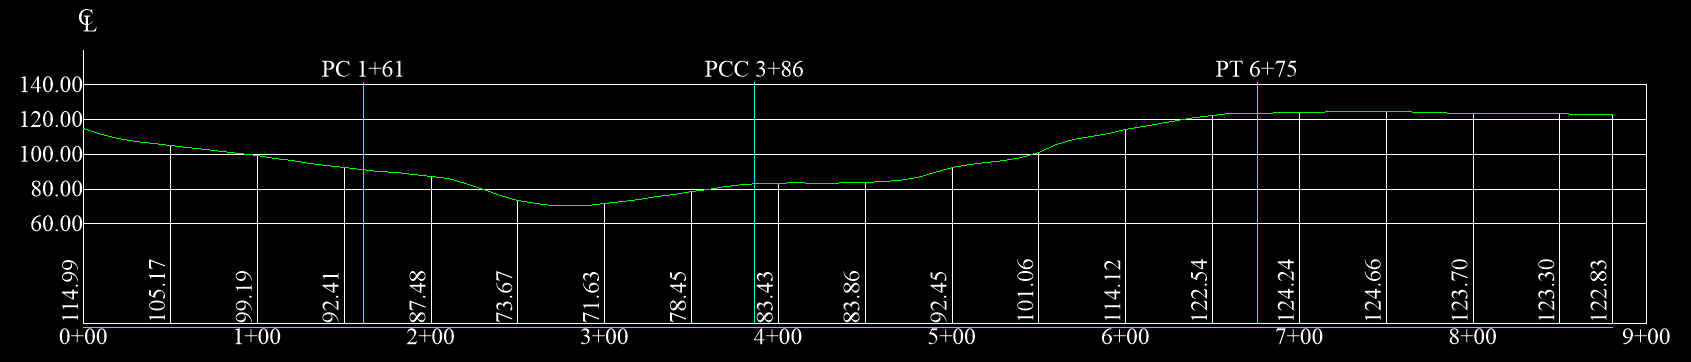
Notice that horizontal curves are labeled.
Here is an example of a the graph that goes onto the clipboard:
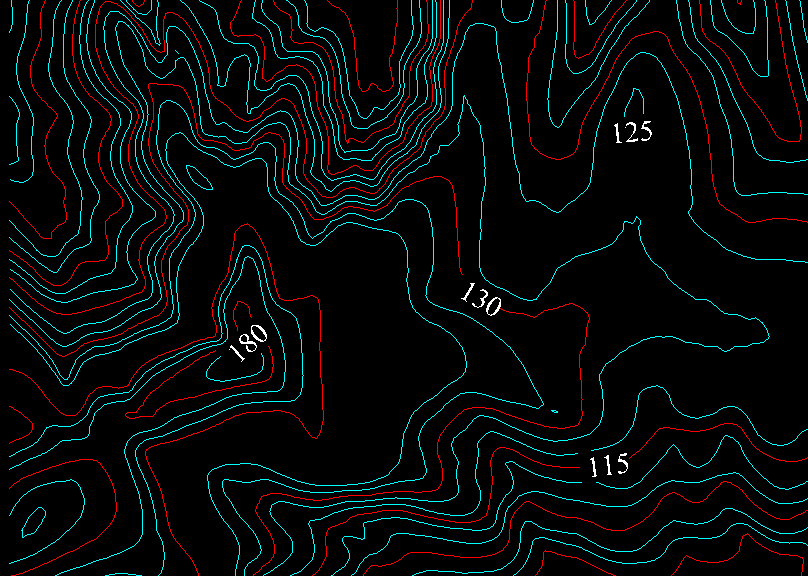
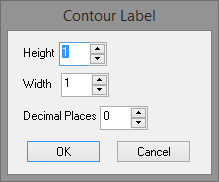
Contour lines are based on the interpolation surface. Levels are labeled with the “Contour Label” tool.
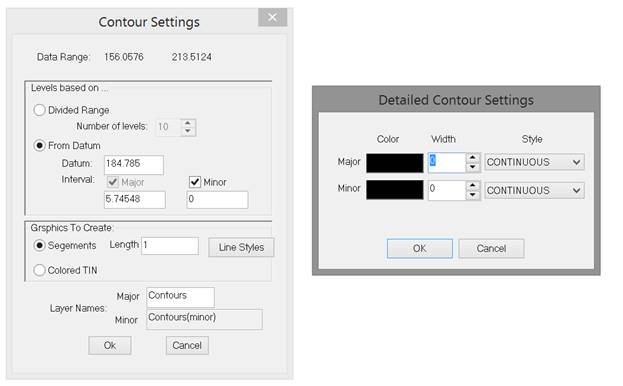
· Divide Range When the “divide range” option is selected the difference between the maximum and minimum elevation is divided by the value specified by “Number of levels”.
· From Datum When “From Datum” is selected the value of “Datum” will be a contour level. It need not be in the data range. The default value of this datum is the average elevation value. Then subsequent contour levels are above and below the datum the distance you set in “Interval.”
· Segment Length The “segment length” determines the accuracy of the iteration as well as the number of points of the contour line. As this number gets small the contour line approaches a continuous curve. As this value gets large the contours are less accurate but the process is faster.
· Layers Name If this box is not empty then the contours layer will be set to this value.
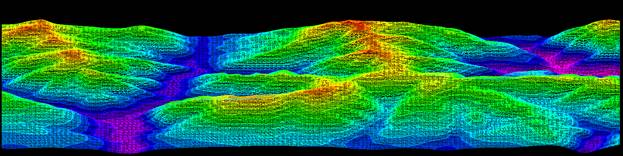
Here is an image with contours on top:
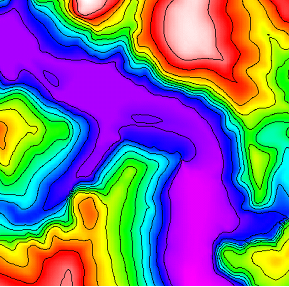
Here an image is used to wrap a surface:
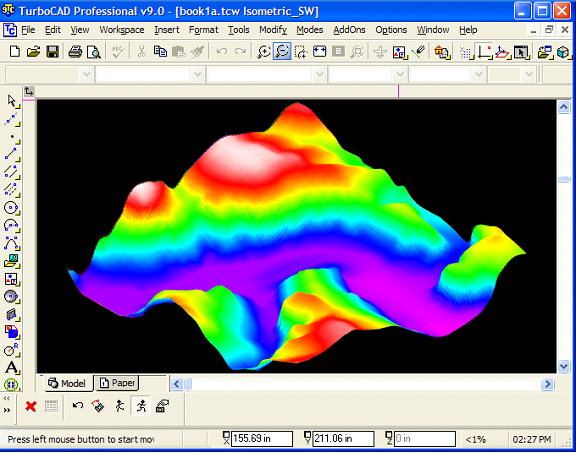
A legend:

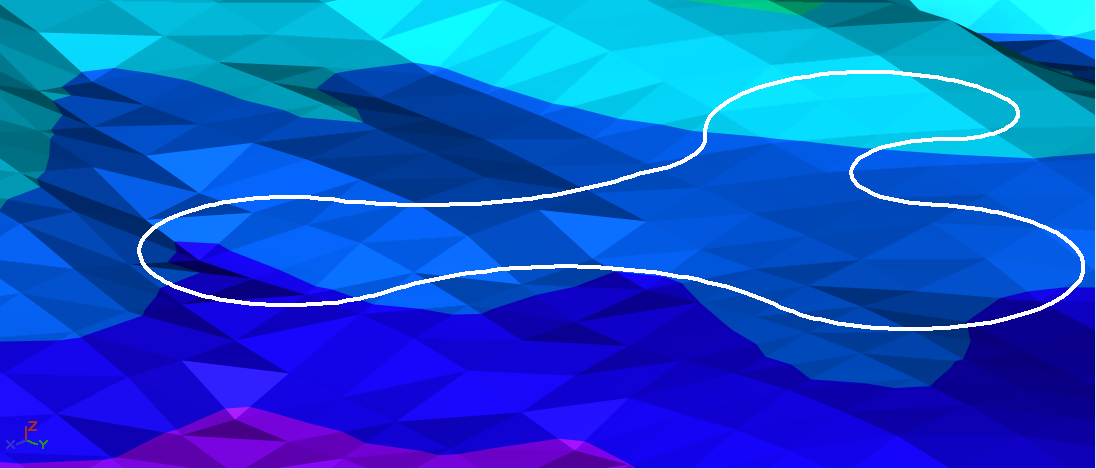
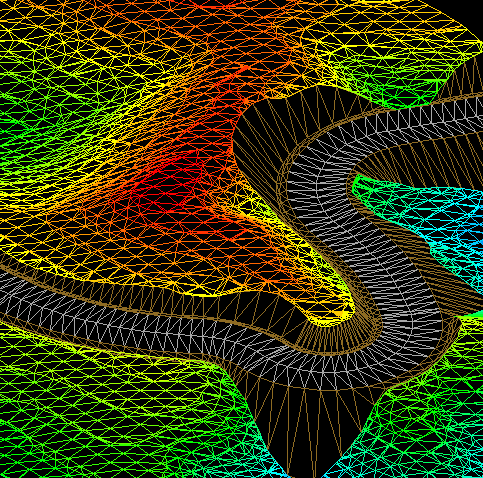
Creates a set of tringles from a polygon used as a centerline.
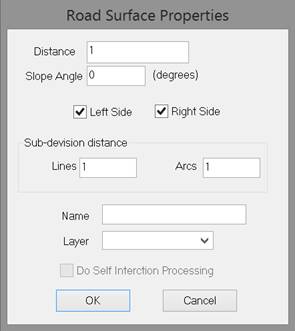
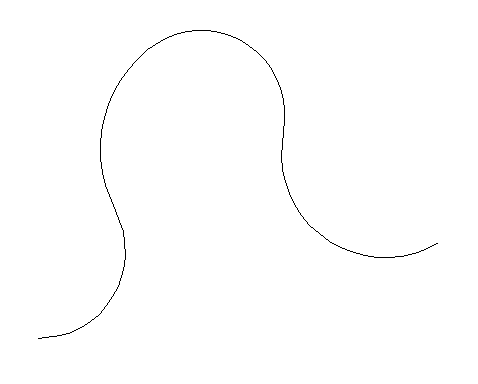
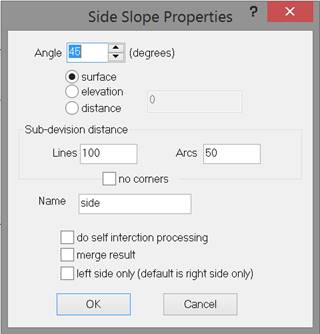
‘Side Slopes’ creates a TIN that extends from the polygon to the active surface. The slopes are determind by the angle you set.
From this:
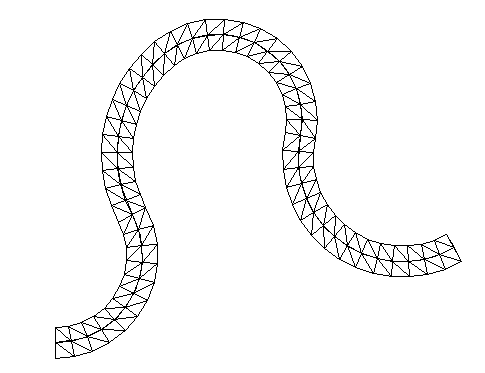
To this:
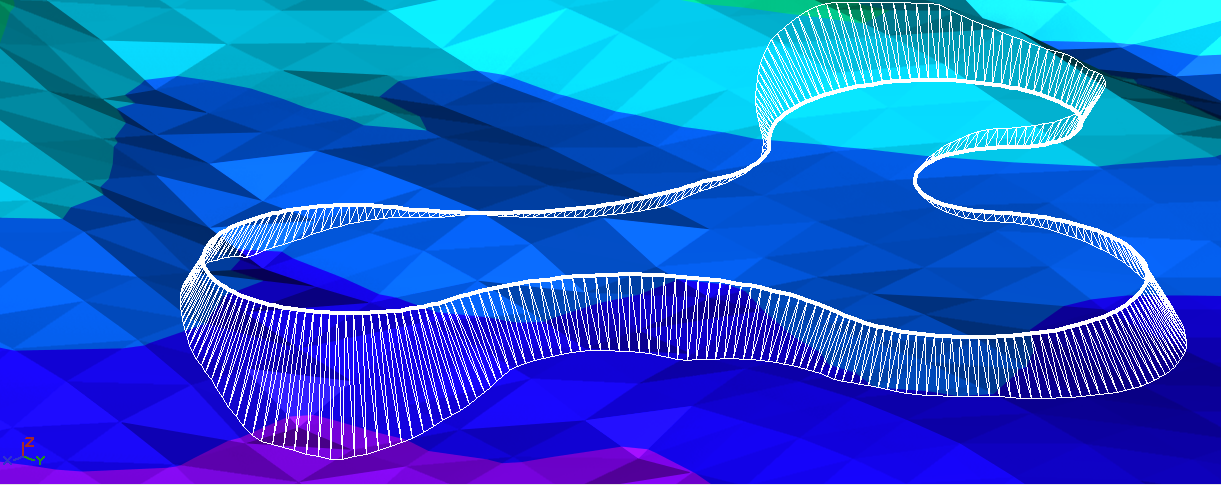
The angle can’t be zero. The slope of the TIN extends downward to the surface from parts of the polygon that are above the surface. The slope of the TIN extends upward to the surface from parts of the polygon that are below the surface.
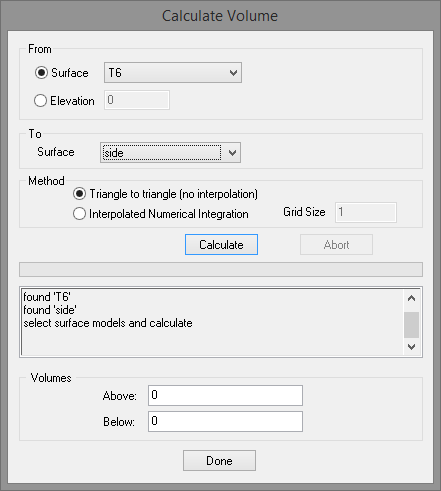
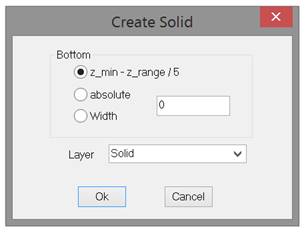
Select the from and to TINs use an elevation. The volumes above and below the from surface will be computed in drawing units.
· Binare Interleave Line - *.BIL
· Spatial Data Transfer Standard - *.DDF
· DEM ASCII
· E00 – *.E00
· ESRI Shape Files - .SHP .DBF .SHX
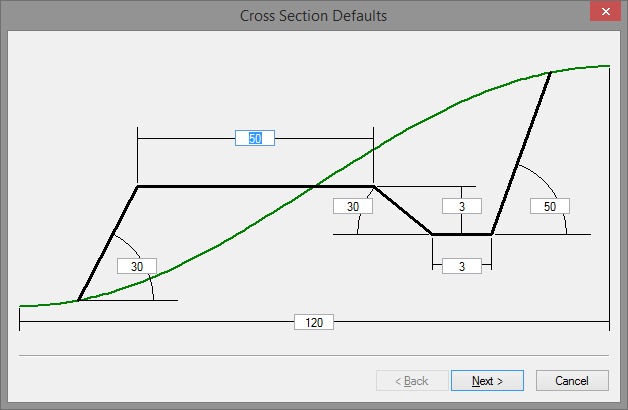
This feature was derived from a combonation of the ”road from center-line” function and the “side slope” function.
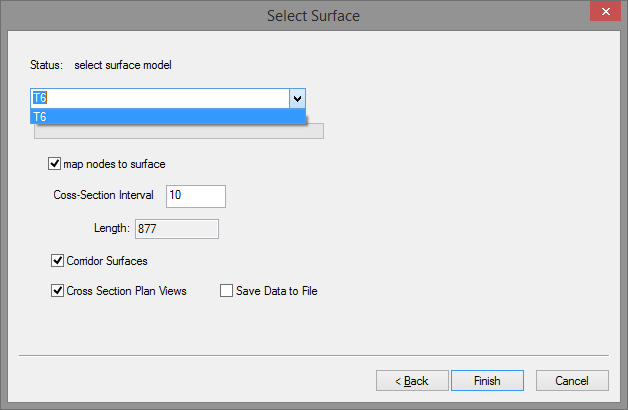
With other tools the cooridore can be embedded into you TIN surface. Here is how: http://www.surfacemodeling.com/Downloads/Movies/CreateRoad-1.wmv.
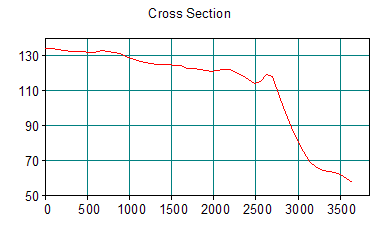
Here is a closer look at a cross section produced for each station.
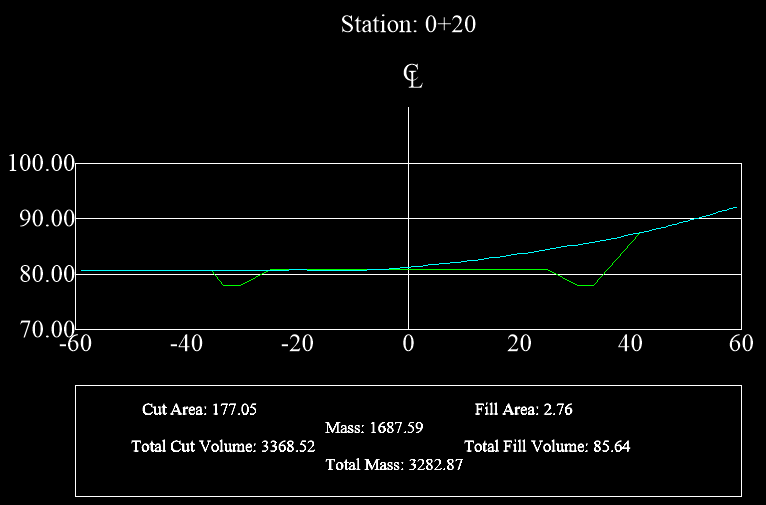
Cut area
Fill are
Incremental cut volume
Incremental fill volume
Total cut volume
Total fill volume
Cut
Surface with Polygon ![]()
Just have a polygon selected.
Launch the Import Points application.
If text is on the clipboard then this button will be active. Selecting it will import that text as points.
If you hav a set of polygons that you want joined into a single polygon you can use this tool to do it. Just have the polygon selected and this tool will find the ones that touch at the ends and join them together into one polygon.
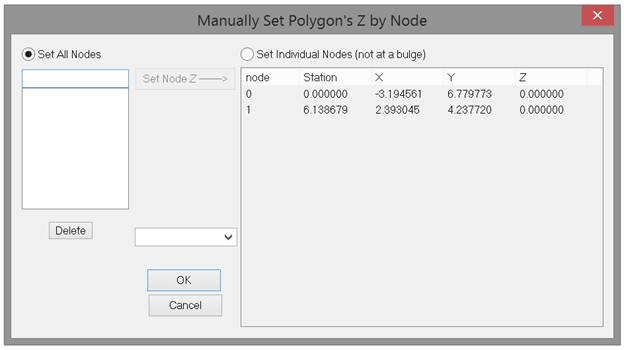
Have a polygon selected.
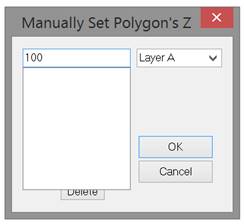
Set a value and click ‘Ok’.
Set
polygon z automatically ![]()
When you select this button all selected text will be used to set the z values of all selected point and polygons.
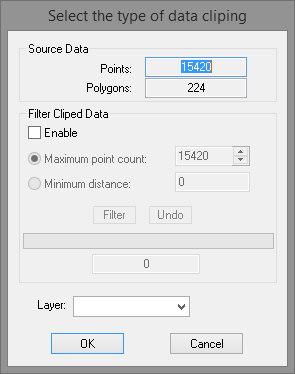
Cut out data from a larger set to a different layer.
See movie in “Triangular irregular network editing” above.
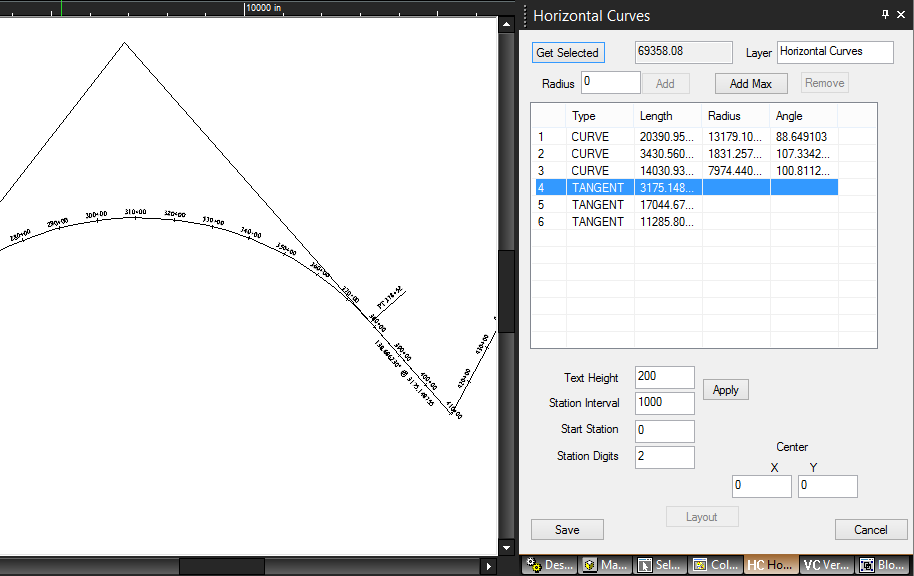
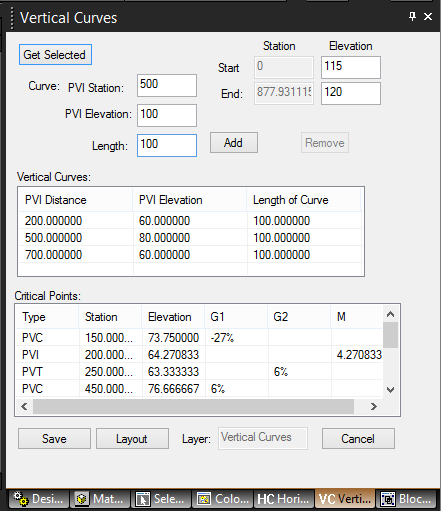
Select a row that represents a PI e.g. of type TANGENT. Then set a radious greater than zero. Finaly select the ‘Add’ button. Or select ‘Add Max’ which will insert the curve of maximum radius that will fit the foreward an back tangents.
Horizontal alignments are drawing elements which are added to the drawing when you select the ‘Save’ button.
The ‘Apply’ button applies changes in text properties to the alignment in the drawing.
Station labeling
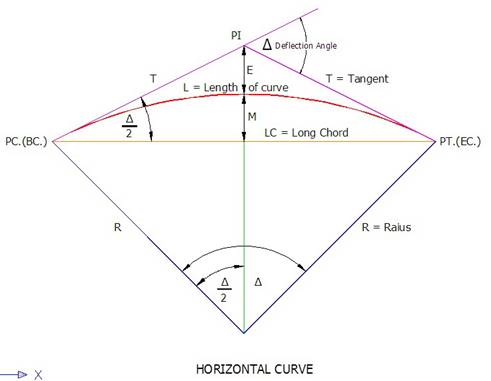
Curve labeling
Tangent Labeling
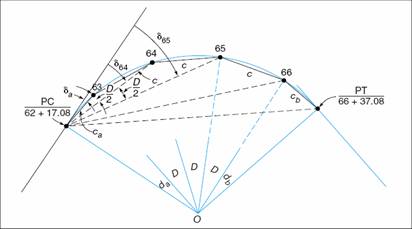
The ‘Layout Button’ will save the following data to a file.
station label - in the form 00+000
station offset - absolute distance from start of center line
station X Y
bearing from PC
distance to PC
incremental cord
PCPI deflection – δn
incremental deflection
PT bearing
PT distance
PTPI deflection
center x y
bearing from center
offset from center
an arbitrary center of curve can be specified
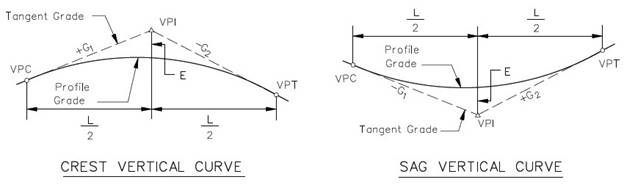
These are the charts added to the drawing.
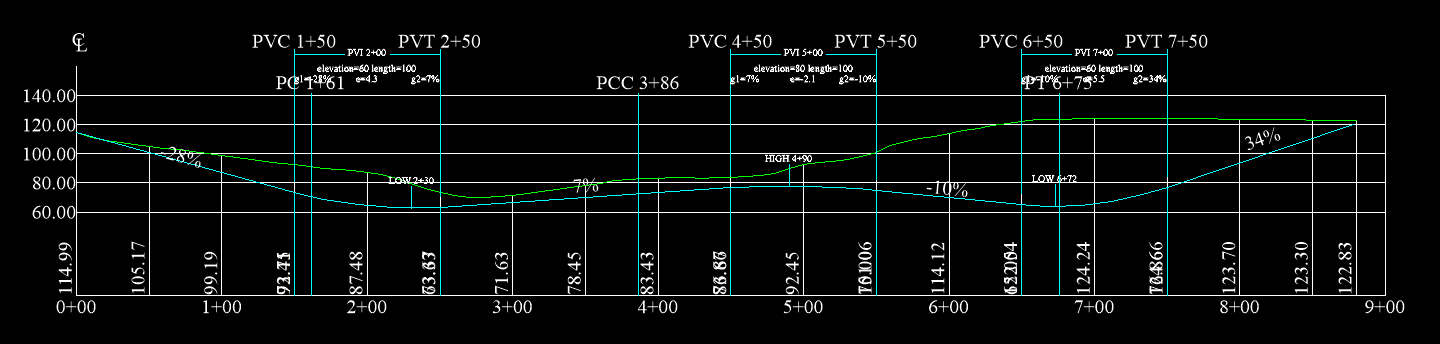
These inlude: elevation of curve, length of curve, PVC, PVT, slopes G1 and G2, slope of tangent areas.
Curve Station Elevation Length
Critical points
PVC G1
PVI M
PVT G2
LOW POINT
HIGH POINT
The ‘Save’ button will save the horivontal alignment in the drawing.
The ‘Layout’bButton will save this data to a file.
From here you can download the geo-referenced image of the window and the data points in a zip file. There are many base maps to choose from. The dat available depends on you zoom level.
http://www.surfacemodeling.com/GetElevationData.aspx
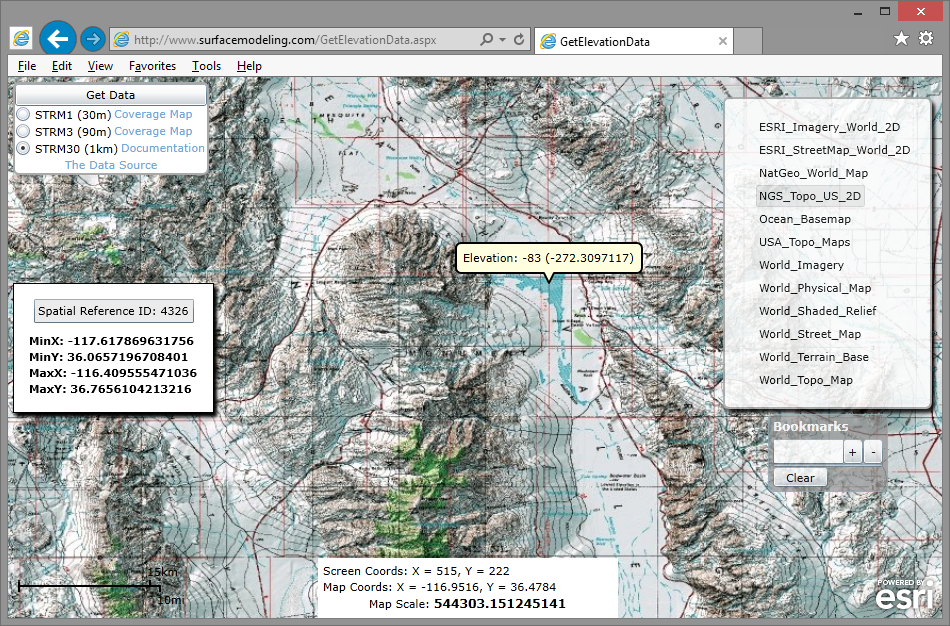
Zoom to your area and select ‘Get Data’.
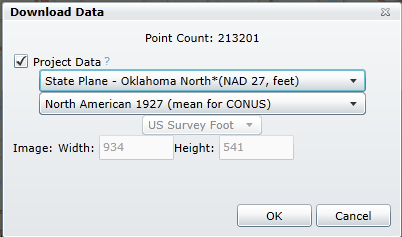
SRTM x y coordinate are longitude latitude respectively. To project the x y of the data use the ‘Project Data’. For more information on coordinate projections here is a source for information http://en.wikipedia.org/wiki/Map_projection.